
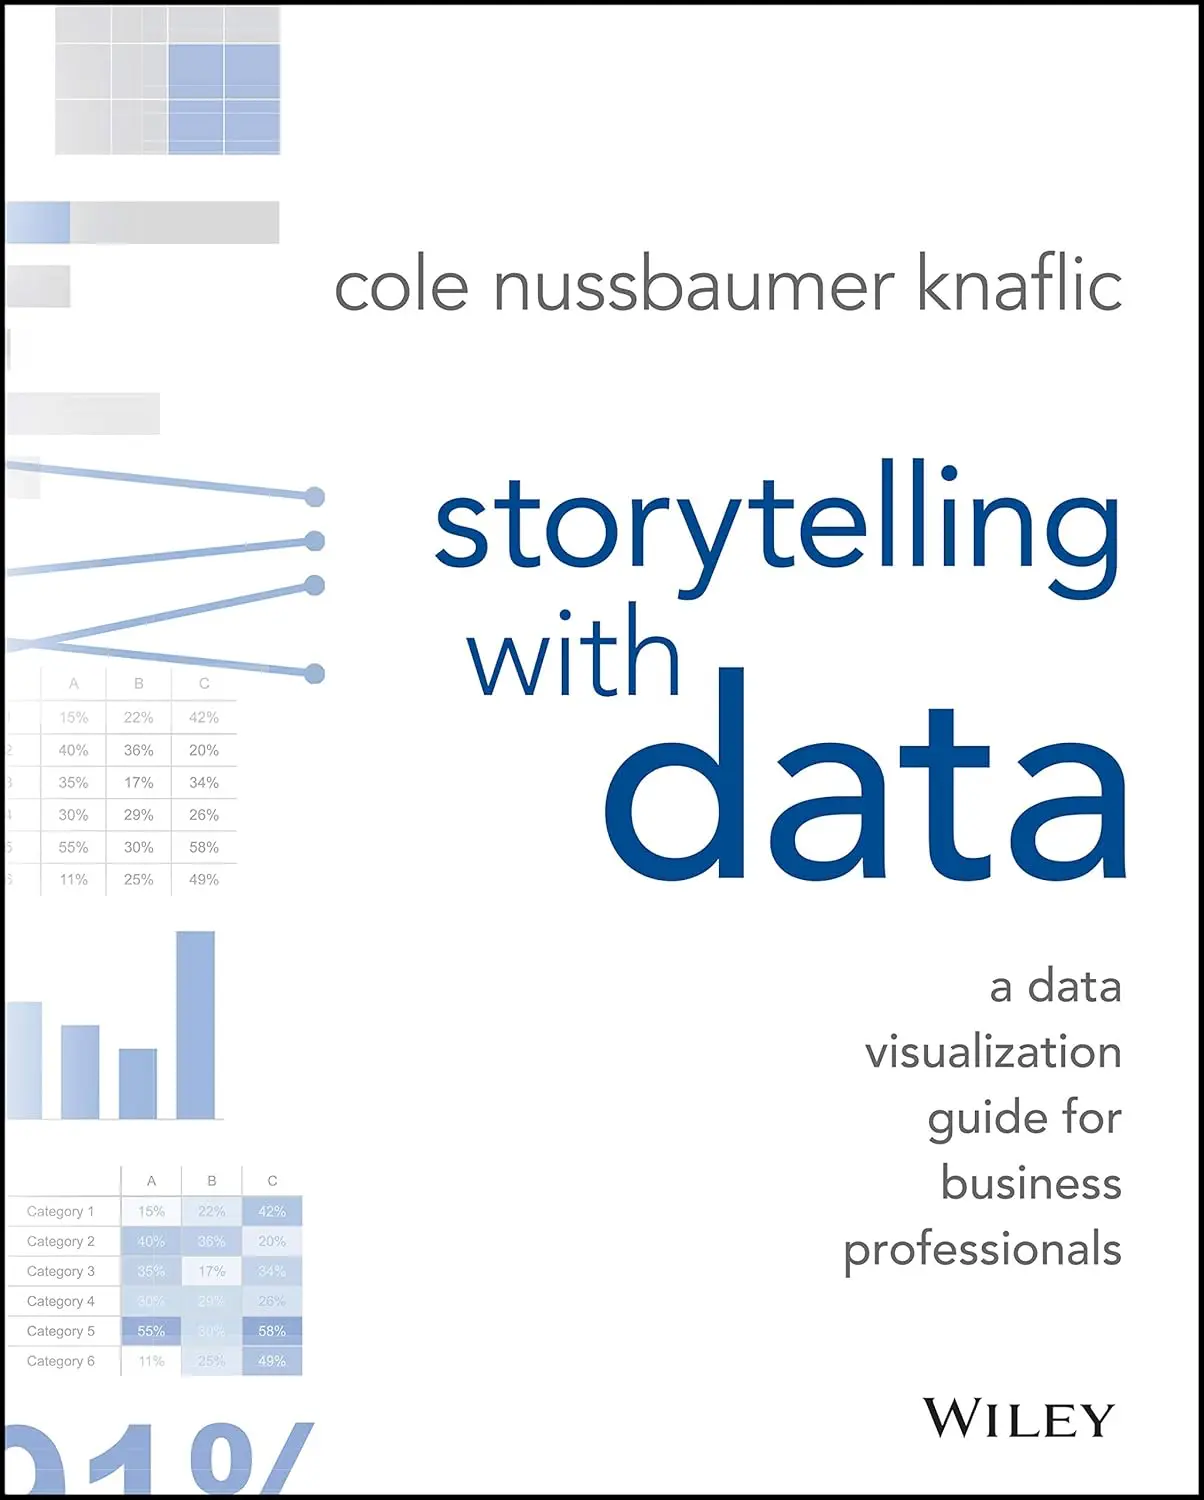
Storytelling with Data is Cole Nussbaumer Knaflic’s guide to presenting data in a way that people actually understand and act on. The book starts from the observation that most business presentations are full of charts that are confusing, cluttered, or simply the wrong type for the data being shown. Knaflic spent years at Google working on data visualization and developed a process for fixing these problems.
The book covers six lessons. First, understand the context: who is your audience and what do you need them to do? Second, choose the right display for your data: sometimes a simple table is better than a chart, and most of the time a bar chart is better than a pie chart. Third, eliminate clutter: remove gridlines, borders, legends, and anything else that doesn’t directly support the message. Fourth, focus attention: use color, size, and position to draw the viewer’s eye to what matters. Fifth, think like a designer: apply basic visual design principles even if you’re not a designer. Sixth, tell a story: give your data a beginning, middle, and end so the audience can follow the narrative.
The before-and-after examples are the book’s strongest feature. Knaflic takes real charts from the business world, shows what’s wrong with them, and then rebuilds them step by step, explaining each design decision. Watching a confusing, cluttered chart transform into a clean, clear one is educational in a way that abstract principles alone can’t be.
For founders, who frequently present data to investors, board members, and team members, the skills in this book are immediately applicable. A pitch deck with clean, well-designed charts makes a materially different impression than one with default Excel graphs. The investment of a few hours learning Knaflic’s approach pays off every time you present data.
The writing is clear and the visual design of the book itself is excellent, as you’d expect from an author writing about data visualization. The book is practical throughout, with exercises at the end of each chapter. It works well as both a first read and a reference to flip back to before building a presentation.
